|
MATHCAD 3-D avi
Who says you can't display 4 dimensions on a CRT display. R2
Controls has done lot's of modeling. In order to explain how a model works
X-Y type graphs can be very helpful. Even simple models can involve
several variables and to see how they are related 3-D graphs literally add a new
dimension to a simple X-Y plot. Excel is not so good for making 3-D graphs
unless you have a graphing "add in" like AXUM. MathCAD however
provides an additional degree of freedom by allowing the animation of a
worksheet. When applied to a 3-D graph, the results can be quite revealing
if the models can output the data in a suitable form. Imagine a tablecloth
flowing over the edge of a falling object and you get the picture. MathCAD
and AXUM are available from http://www.mathsoft.com.
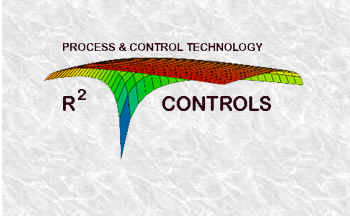
- AVI #1 is R2 Controls Logo but animated - This is a model of
the gross profit in $/Day for a distillation column at a gas plant in
Louisiana. The X-Axis is the iso-butane in the n-butane product, the
Y-axis is the n-butane in the more valuable iso-butane product. The
Z-axis is profit. The downward spike in the graph of R2
Controls logo is a result of enormous energy costs as the products approach
perfect purity.
Surface of increasing energy cost.avi
- AVI #2 is using the distillation column model as above but instead of
varying the energy cost we vary the relative value of the products.
iso-butane sell price is gradually increased as the time axis. This
definitely shifts the optimum operating point.
Surface of increasing iso value.avi
- AVI #3 is the exact same surface as shown above except we animate a
contour plot rather than a surface plot. In many ways the contour plot
is more useful to see how the optimum operating point shifts with increasing
value of the iso-butane product.
Contour of increasing iso value.avi
- AVI #4 Comes from a compressor project. As gas well pressure
declines it takes ever more Compressor power to recover a given quantity of
Gas. Imagine an Electric drive Compressor sucking gas out of a
well. The compressor power is expensive and limits how much gas can be
recovered. As well pressure drops more electric power is required to
recover the gas. Pick a price for electric power and you can see how
the optimal gas recovery drops as the well pressure declines (over a period
of years).
Optimization Contour of declining well pressure.avi
Note: these *.AVI files are about 1 MB each and may take a while to load if
you have a slow connection. You will also need a mediaplayer. You
can download Windows Media Player from http://microsoft.com
|